
SEPTEMBER 21, 2026 - 4 MIN READ
Trace Snowflake spend from high level trends to exact query text with Slingshot
- Cloud Cost Management (FinOps)
- Data Governance
- Data Observability

Alex GuoProduct Marketing Manager, Capital One Software
Snowflake captures rich performance and tagging data, but finding the root cause of a cost spike usually takes manual investigation across multiple reports and individual execution logs. Today, we are excited to announce two new capabilities now generally available in Capital One Slingshot to address this challenge: Data Explorer and Query Details.
Data Explorer simplifies cost tracking by unifying spend across all your Snowflake accounts into a single view with interactive analytics, letting you drill down from high-level totals to specific resources and uncover the root cause of cost anomalies in just a few clicks.
Query Details simplifies log analysis by automatically grouping query runs using Snowflake’s Parameterized Query Hashes (opens in new tab) and analyzing key execution metrics. This helps you quickly identify if anomalies are driven by poor filtering, system load or undersized warehouses.
Here’s a closer look at how both features work.
Drill down from spend trends to root cause with Data Explorer
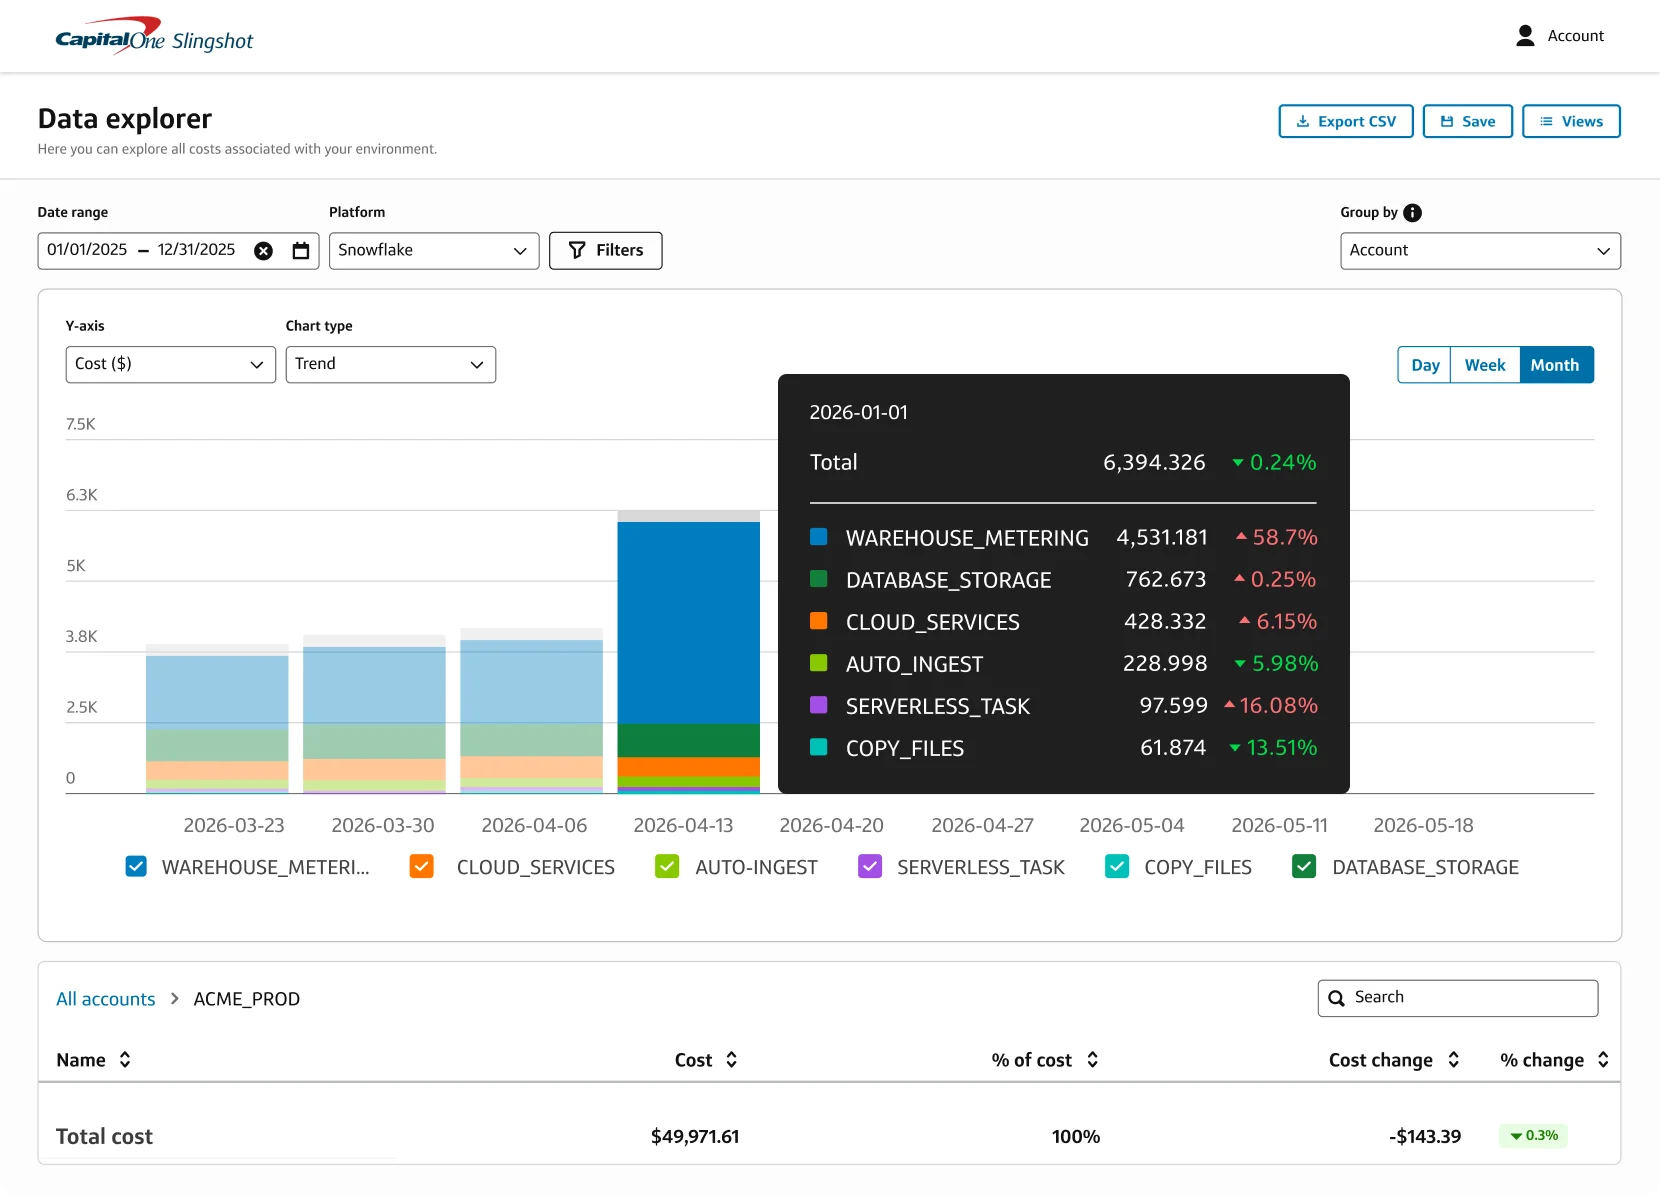
In three clicks you can drill down to the Query Hash responsible for a cost spike.
Data Explorer simplifies how you analyze and control Snowflake spend across accounts. You can now slice and dice Snowflake spend across resources, queries, users and custom tags to quickly trace cost spikes to their root cause. Interactive charts and tables stay in sync as you drill down into cost trends, while saved custom views and role-based access controls let you share standardized reports safely across roles.
Eliminate context switching: Unify up to two years of cost history across all of your Snowflake accounts in a single view to identify seasonal and long-term patterns.
Standardize spend reporting: Save custom filters and date ranges as personal reports or publish standardized reports across business units to replace ad-hoc data requests.
Maintain secure governance: Automatically enforce role-level access controls so users can only see cost data that they have access to in Slingshot.
With Data Explorer, you are no longer limited to fixed reports. Instead, you can jump from high-level account overviews to specific query spikes in just a few clicks, revealing exactly where and when spend shifted to set up instant root cause analysis.
Pinpoint performance bottlenecks with Query Details
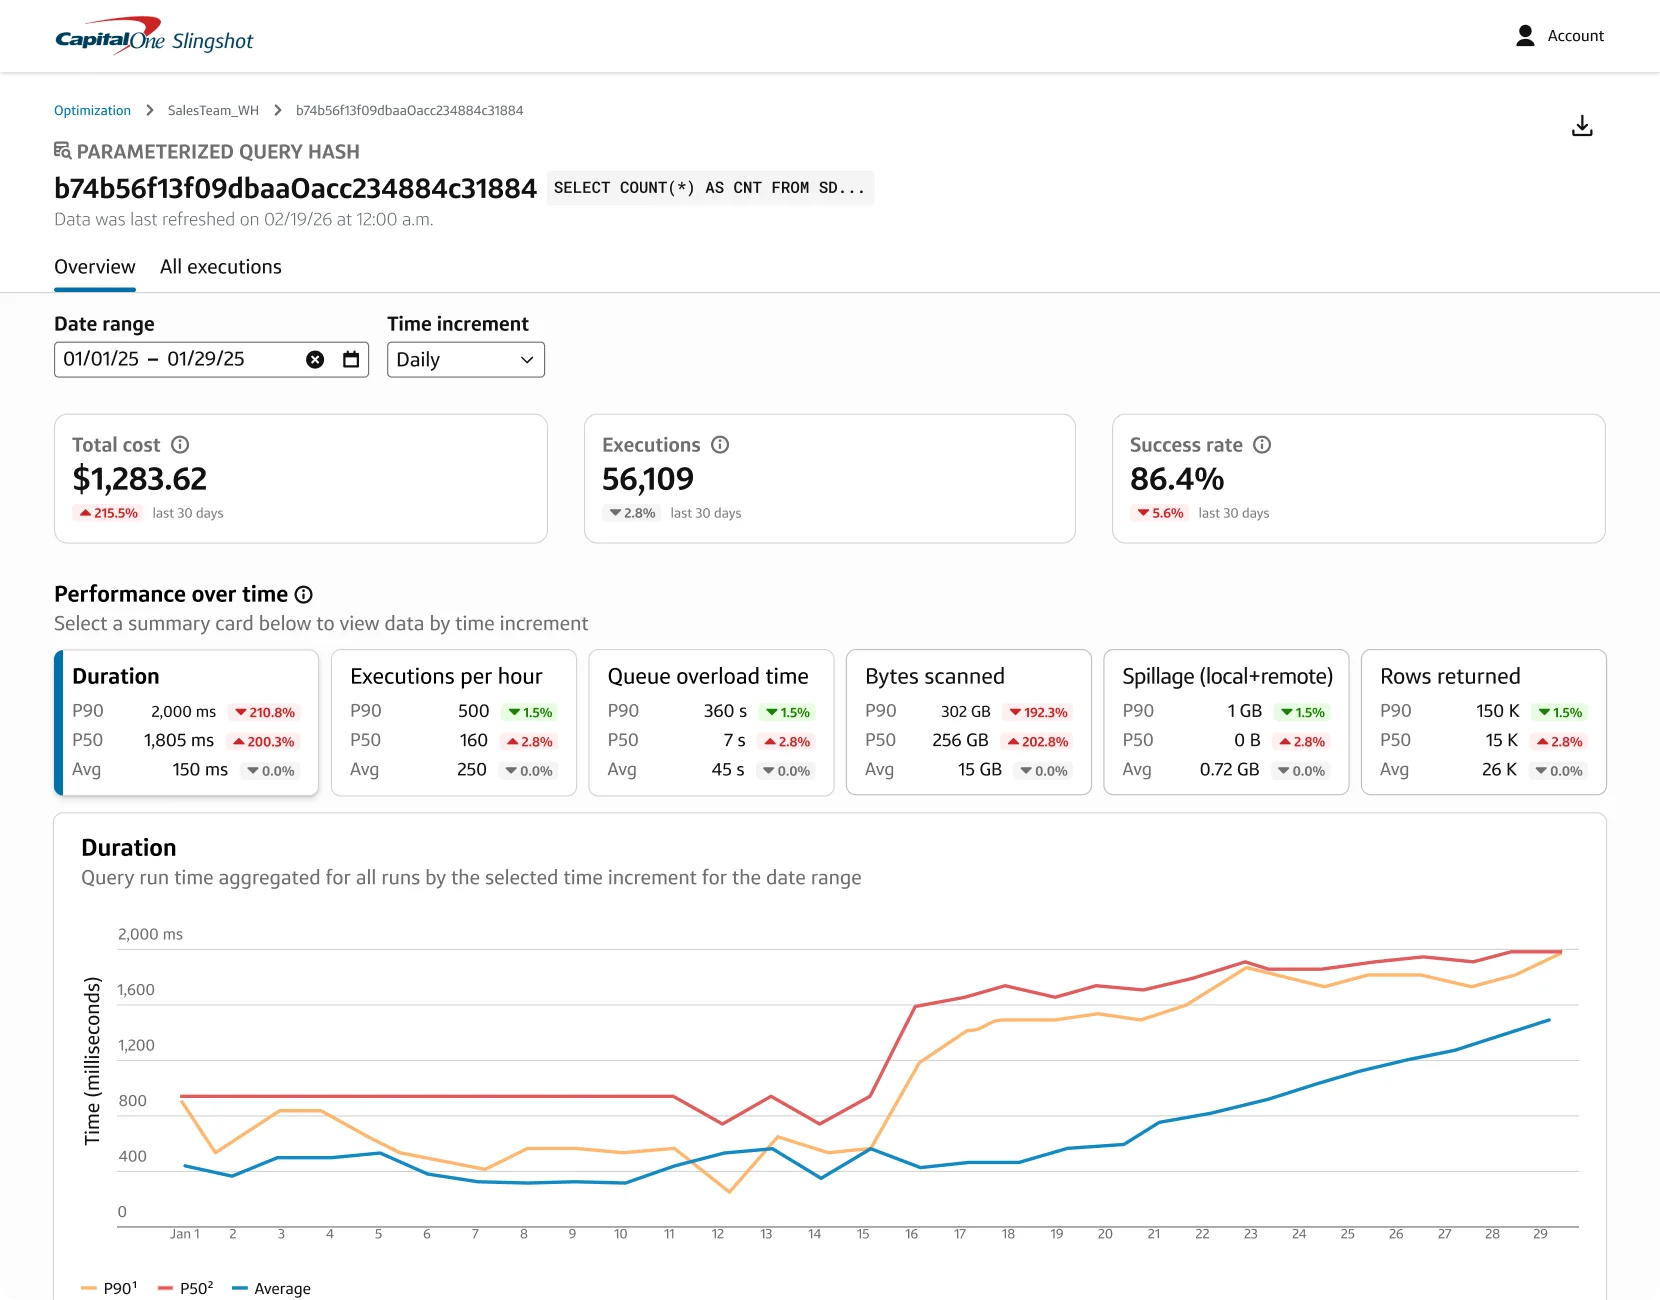
Once Data Explorer helps you drill down from high-level spend to locate a specific high-cost query, Query Details shows you exactly how it ran. Slingshot automatically groups similar queries together using Parameterized Query Hashes, making it easy to track performance trends over time as data grows. For deeper troubleshooting, you can click into individual query runs by Query ID to see the metrics of any single execution.
Benchmark performance trends: Track average (baseline), P50 (median) and P90 (90th percentile) run times to catch heavy queries before they cause system blocks or delays.
Evaluate scanning efficiency: Analyze bytes scanned to evaluate data filtering and ensure queries only process necessary data.
Manage queue bottlenecks: Monitor queued time to surface warehouse concurrency limits and prevent system overload during peak usage hours.
Optimize memory constraints: Identify disk spills to flag undersized warehouses and fix memory bottlenecks driving up compute costs.
With Query Details, you no longer have to guess why a cost spike occurred. Now you can jump straight from broad spend trends to specific execution bottlenecks, giving you the exact root cause needed to fix performance and lower compute spend.
Conclusion
Using Data Explorer and Query Details together makes troubleshooting fast and cost analysis easier. When a Slingshot cost spike alert goes off, you can open Data Explorer and group spend by team tags. Clicking a team filters the view to show only their warehouses.
From there, you can look at the costliest Parameterized Query Hashes on that specific warehouse. In less than a minute, you move from a cost spike to the exact query text and metrics responsible.
Slingshot changes how you run your data system. By tracking costs and query performance in one place, you can fix waste without losing engineering time. This makes cost control a clear science and helps you scale your system safely.
Interested in seeing how Data Explorer and Query Details look against your own workloads? Book time with the Slingshot team here.
Alex Guo
Product Marketing Manager - Capital One Software
Alex is a Product Marketing Manager at Capital One Software, leading go-to-market initiatives for Slingshot. He focuses on helping enterprise organizations optimize performance and control compute costs as they scale heavy data and AI workloads across Snowflake. Previously, he drove product marketing strategies at Datadog and Attentive.
Footnotes
DISCLOSURE STATEMENT: © 2026 Capital One. Opinions are those of the individual author. Unless noted otherwise in this post, Capital One is not affiliated with, nor endorsed by, any of the companies mentioned. All trademarks and other intellectual property used or displayed are property of their respective owners.